
Why is there such wide variation in mental health bed usage?
Mental Health trusts recognise the need to ‘left shift’ support away from wards and into community settings. This is often framed as a whole system challenge involving social care and wellbeing partners, both NHS and non-NHS organisations.
It is interesting then that per capita social care spend and the level of a mental health provider’s control over community health services has no correlation with mental health bed days.
Read more
Management focus
Management teams are right to be concerned that funding allocations align with population need. The focus, however, needs to be service design and operational rigours.
It is variation in Acute pathway flow optimisation that is separating high from low bed users. Some trusts have a significant gap to close on peers.
What is the level of bed use variation by trust?
It is currently possible to analyse FY2024/25 data across the populations served by Mental Health trusts in England. Our analysis focuses on the working age Acute pathway, we have included PICU bed days to facilitate comparability across trusts. We know from experience PICU thresholds differ and service users can often become stuck in a PICU ward awaiting step back down to an Acute ward.
The chart below benchmarks every trust’s bed use by its working age weighted population. A trust’s bed days are those that relate to its catchment area, it includes days spent by its catchment population in another provider’s beds and excludes other providers’ service users bed days.
The median is 23.2 occupied beds per 100,000 needs-weighted 18-64yrs population1. Trust variation from this average ranges from +54% (Greater Manchester) to -29% (Cambridgeshire and Peterborough). The top 3 bed users by needs-weighted population are trusts in the North West.
Chart 1 – Benchmark
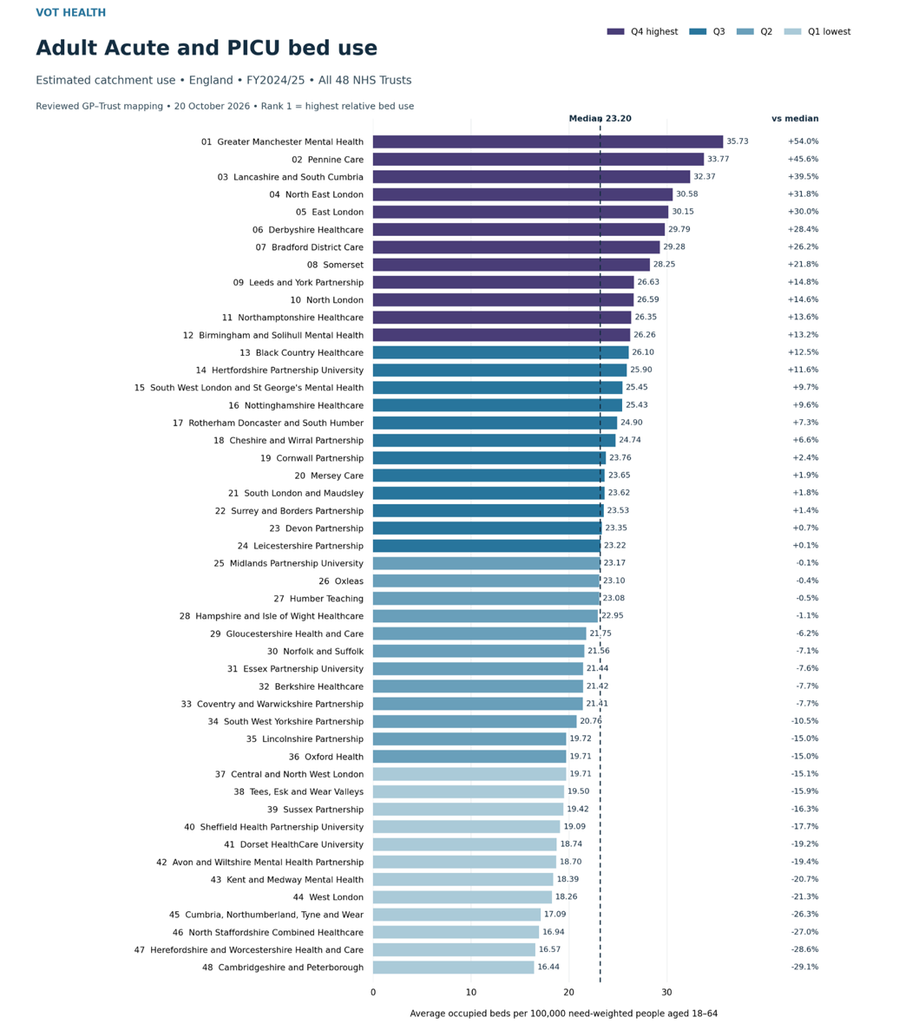
So, what is driving this variation? There is no obvious separation by location or whether the mental health service provider also assumes responsibility for community health services in its geographies
Social care spend does not correlate with bed usage
Social care spend on mental health by weighted population can be mapped back to provider catchments. Spend ranges between £14.4 to £57.1 per person (median £36.54) across the 48 Mental Health trusts2.
Given discharge delay is an oft quoted challenge, it might be expected that high bed usage is related to low social care spend but this is not the case. There is no statistical correlation between weighted per capita social care spend and beds days
This is not to say that social care investment does not matter, how the money is spent appears to be part of the pathway improvement challenge. From experience, there is often a mismatch between local authority provision and the type of support needed to facilitate discharge, such as specialist supported accommodation.
Trusts sometimes address a provision gap by spending monies from their own NHS budgets to commission step down beds to accommodate medically fit patients awaiting accommodation.
Population need does correlate with bed usage
A higher relative need factor for a trust’s catchment population is likely to translate into higher need adjusted bed usage. Noting this correlation is modest not strong.
Chart 2 – Correlation
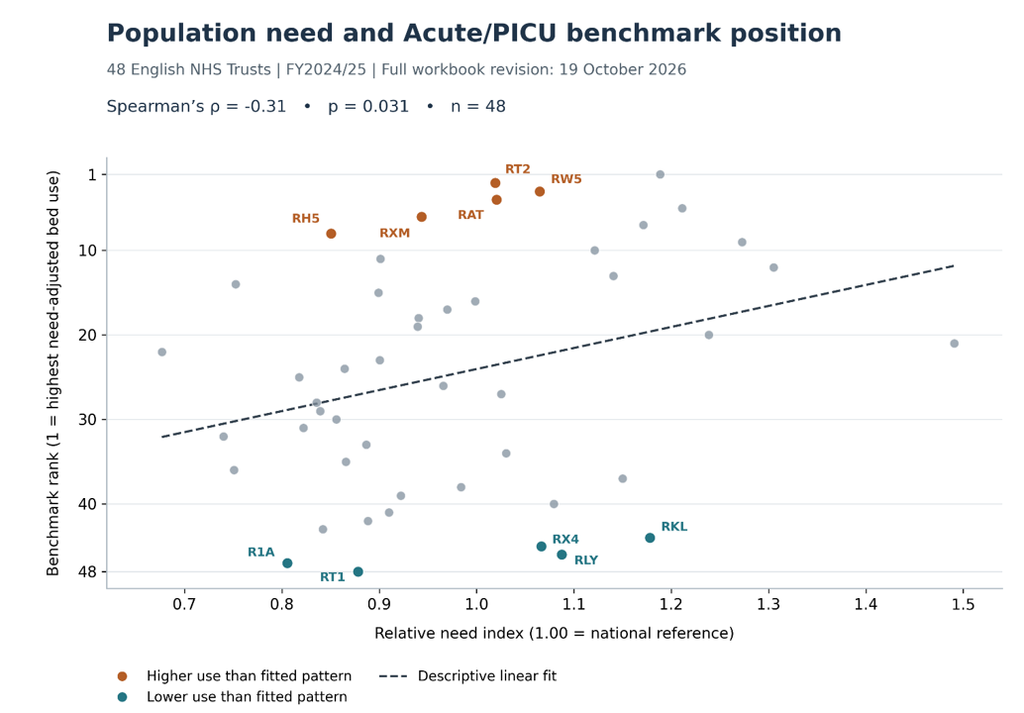
Operationally, we know that complex patients form the tail of long stayers that drive up average length of stay. Prima facie the need index may not be sufficient to reflect the needs of the most economically and socially challenged. Mental Health trusts too often find themselves holding inpatients whilst dealing with wider social and accommodation needs.
What’s interesting are the outliers in the chart above, i.e. those trusts labelled with higher or lower bed usage than might be expected for a particular population need.
What can we learn from the exemplars?
The four outlying trusts that we can perhaps learn from the most are listed below:
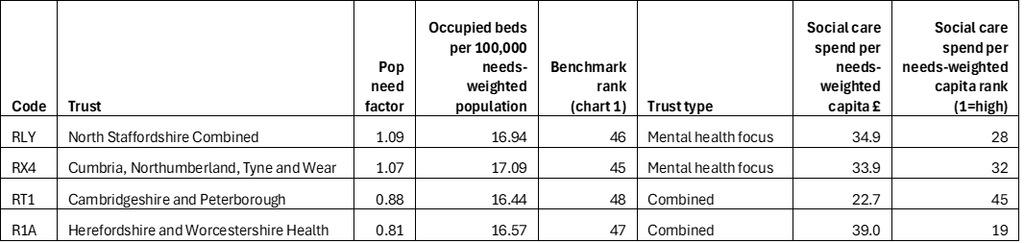
These same trusts also rank in the bottom 4 places of the bed use benchmark (chart 1). So, what stood them apart in FY2024/25? Desktop research highlights some common features:
- Strict gatekeeping of beds
All these trusts stress the control given to CRHT teams to gatekeep their acute mental health hospital admissions and provide intensive home treatment as an alternative.
- Proactive flow management
This takes different forms to expedite discharges from wards. Common themes include the active support of CRHT or community teams to facilitate early discharge; & senior clinical review to ensure purposeful admission and to address delays for patients with extended stays. The result is that trusts in this cohort report nationally low length of stay, half the level of the national average at times for FY2024/25.
- Admission avoidance
These trusts flag the transformation of community support to avoid admissions. Post-discharge care and relapse planning to reduce readmission has been a focus. As is improving emerging crisis monitoring and a swift co-ordinated response to prevent a future admission.
Cambridge and Peterborough during FY2024/25 became the first mental health trust to establish a virtual ward, which is providing Clozapine initiation safely at home instead of on the ward.
- Crisis alternatives
This cohort of trusts all provide some sort of crisis alternative setting; this might be a crisis house; crisis pod/lounge; haven or safe space.
Conclusion
We hope that this analysis provides helpful insight to management teams battling with demand pressure on beds.
In our view, there is no substitute for getting onto the frontline to walkthrough the Acute pathway to truly understand the scope for improvement. Benchmarks are just a call to action.
FY2025/26 figures will soon become available, expected Jan-27. Please look out for the refresh, as we track which trusts ‘left shift’ the most.
Some trusts, of late, have achieved sharp reduction in out of area placements. Corresponding improvement in the occupied beds per 100,000 needs-weighted population metric would confirm model redesign success.
- Source: FY2024/25 Mental Health Bulletin, Chapter 4, in-year occupied bed-days by patient-home Sub-ICB location and adult acute bed type – Bed type 200 Acute Adult MH plus 202 Adult PICU; exclude 201 Older Adult Acute. 106 Sub-ICBs mapped to providers, in 22 cases the sub-ICB covers multiple providers, so bed days allocated by share of weighted population. For 7 sub-ICBs a significant no. of bed days are being allocated across providers, this affects the robustness of benchmarking for 10 of 48 trusts, seven in London (all except SLaM); Devon Partnership; Berkshire Healthcare; & Surrey and Borders. Sources: NHS England 2023/24–2024/25 allocations spreadsheet D (mental-health need), GP need weights age/sex weights; NHS digital monthly publications of patients registered at a GP practice. Weighted-need population measure: Sum of mean practice counts × published age/sex weights, normalised across all England practices. Every GP mapped to a provider. ↩︎
- Source: DHSC Adult Social Care Finance Return 2024/25, CSV data pack dated 24 October 2025. Measure: Mental health support net current expenditure (£), ages 18–64, divided by the normalised need-weighted population aged 18–64 by trust (see note 1). Long- and short-term care combined, all care settings, e.g. Nursing, residential, supported accommodation, direct payments, home care, supported living. ↩︎
